head pgc.cross.SCZ17.2013-05.txt

snpid hg18chr bp a1 a2 or se pval info ngt CEUaf
rs3131972	1	742584	A	G	1	0.0966	0.9991	0.702	0	0.16055
rs3131969	1	744045	A	G	1	0.0925	0.9974	0.938	0	0.133028
rs3131967	1	744197	T	C	1.001	0.0991	0.9928	0.866	0	.
rs1048488	1	750775	T	C	0.9999	0.0966	0.9991	0.702	0	0.836449
rs12562034	1	758311	A	G	1.025	0.0843	0.7716	0.988	0	0.0925926
rs4040617	1	769185	A	G	0.9993	0.092	0.994	0.979	0	0.87156
rs4970383	1	828418	A	C	1.096	0.1664	0.5806	0.439	0	0.201835
rs4475691	1	836671	T	C	1.059	0.1181	0.6257	1.02	0	0.146789
rs1806509	1	843817	A	C	0.9462	0.1539	0.7193	0.383	0	0.600917
Metadata:
Mean chi^2 = 1.229
Lambda GC = 1.201
Max chi^2 = 32.4
11 Genome-wide significant SNPs (some may have been removed by filtering).

Conversion finished at Mon Apr  4 13:21:29 2016
Total time elapsed: 16.07s
Bulik-Sullivan, B., Loh, PR., Finucane, H. et al. LD Score regression distinguishes confounding from polygenicity in genome-wide association studies. Nat Genet47, 291–295 (2015). https://doi.org/10.1038/ng.3211
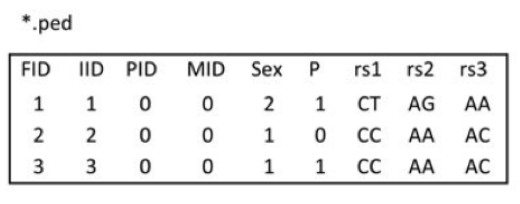
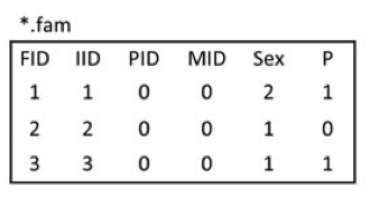
1.ped,pedigree file。ped文件一般包含6+2N列,第一至六列分别为 1. Family ID 2. Individual ID 3.Mother ID 4.Father ID 5.Sex 6.Phenotype。第六列以后为各个SNP的等位基因,两列一组,可以使用具体的碱基,也可以使用拷贝数(0,1)。
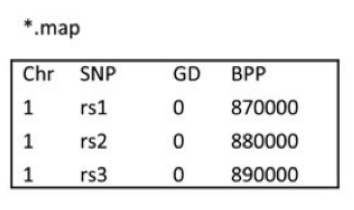
2. map,与ped文件相伴随的文件,主要包含ped文件中SNP的位置信息。一般包含4列。分别是1. 染色体号 2.SNP ID 3.遗传图距(单位为摩根或厘摩,通常分析不需要这一列,使用哑值(dummy value) 0 填充) 4.碱基对坐标。每行一个SNP,顺序与ped文件中的SNP相对应。
downloaded data (VCF.gz and tab-indices), ~ 15.5 GB
converted BCF files and their indices, ~14 GB
binary PLINK files, ~53 GB
pruned PLINK binary files, ~ <1 Gb
2.2 下载所用数据 (本教程数据主要来自1000 Genomes Phase III imputed genotypes)
2.3 下载对应每条染色体的vcf文件
prefix="ftp://ftp.1000genomes.ebi.ac.uk/vol1/ftp/release/20130502/ALL.chr" ;

suffix=".phase3_shapeit2_mvncall_integrated_v5b.20130502.genotypes.vcf.gz" ;

for chr in {1..22}; do
    wget "${prefix}""${chr}""${suffix}" "${prefix}""${chr}""${suffix}".tbi ;
done
2.4 下载 1000 Genomes Phase III 的 ped文件,包含了个体性别,群体等基本信息
#Populations

This file describes the population codes where assigned to samples collected for the 1000 Genomes project. These codes are used to organise the files in the data_collections' project data directories and can also be found in column 11 of many sequence index files.

There are also two tsv files, which contain the population codes and descriptions for both the sub and super populations that were used in phase 3 of the 1000 Genomes Project:

<ftp://ftp.1000genomes.ebi.ac.uk/vol1/ftp/phase3/20131219.populations.tsv>
<ftp://ftp.1000genomes.ebi.ac.uk/vol1/ftp/phase3/20131219.superpopulations.tsv>

###Populations and codes

         CHB	Han Chinese             Han Chinese in Beijing, China
         JPT	Japanese                Japanese in Tokyo, Japan
         CHS	Southern Han Chinese    Han Chinese South
         CDX	Dai Chinese             Chinese Dai in Xishuangbanna, China
         KHV	Kinh Vietnamese         Kinh in Ho Chi Minh City, Vietnam
         CHD	Denver Chinese          Chinese in Denver, Colorado (pilot 3 only)

         CEU	CEPH                    Utah residents (CEPH) with Northern and Western European ancestry
         TSI	Tuscan                  Toscani in Italia
         GBR	British                 British in England and Scotland
         FIN	Finnish                 Finnish in Finland
         IBS	Spanish                 Iberian populations in Spain

         YRI	Yoruba                  Yoruba in Ibadan, Nigeria
         LWK	Luhya                   Luhya in Webuye, Kenya
         GWD	Gambian                 Gambian in Western Division, The Gambia
         MSL	Mende                   Mende in Sierra Leone
         ESN	Esan                    Esan in Nigeria

         ASW	African-American SW     African Ancestry in Southwest US
         ACB	African-Caribbean       African Caribbean in Barbados
         MXL	Mexican-American        Mexican Ancestry in Los Angeles, California
         PUR	Puerto Rican            Puerto Rican in Puerto Rico
         CLM	Colombian               Colombian in Medellin, Colombia
         PEL	Peruvian                Peruvian in Lima, Peru

         GIH	Gujarati                Gujarati Indian in Houston, TX
         PJL	Punjabi                 Punjabi in Lahore, Pakistan
         BEB	Bengali                 Bengali in Bangladesh
         STU	Sri Lankan              Sri Lankan Tamil in the UK
         ITU	Indian                  Indian Telugu in the UK

Should you have any queries, please contact info@1000genomes.org.
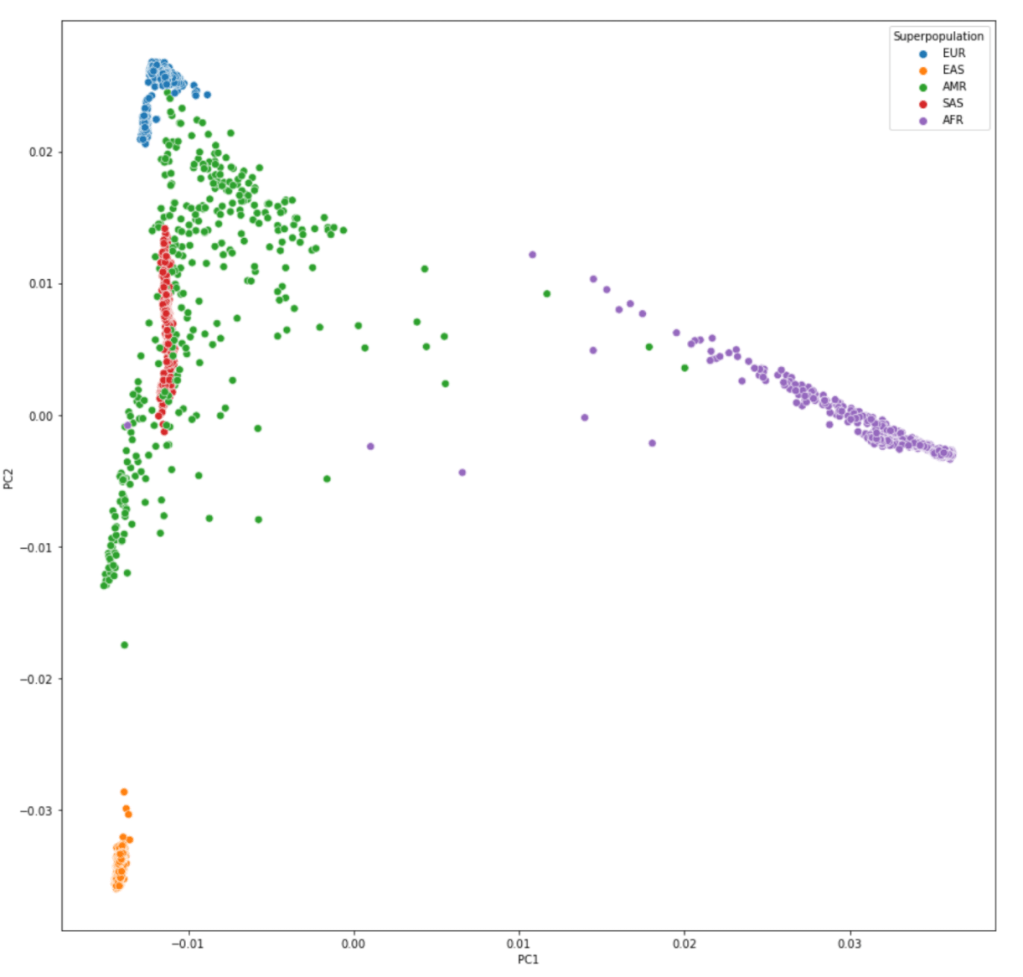
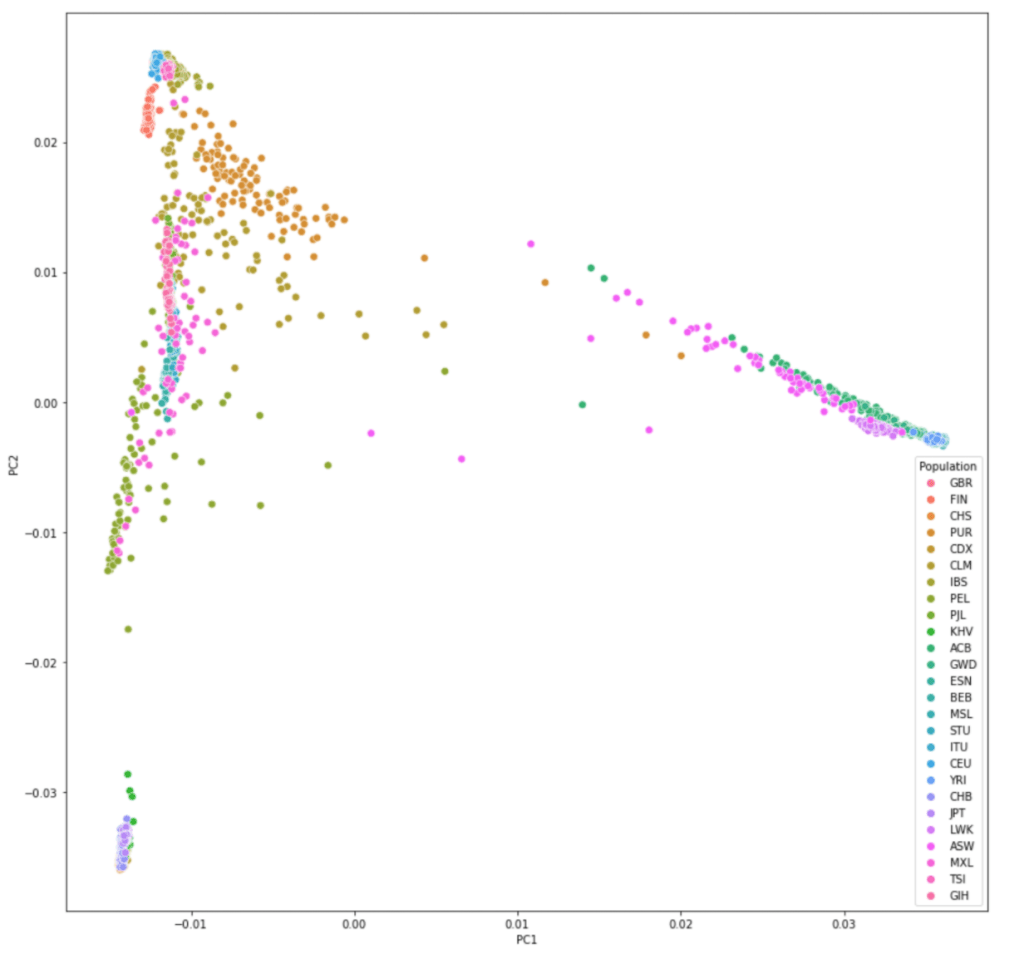
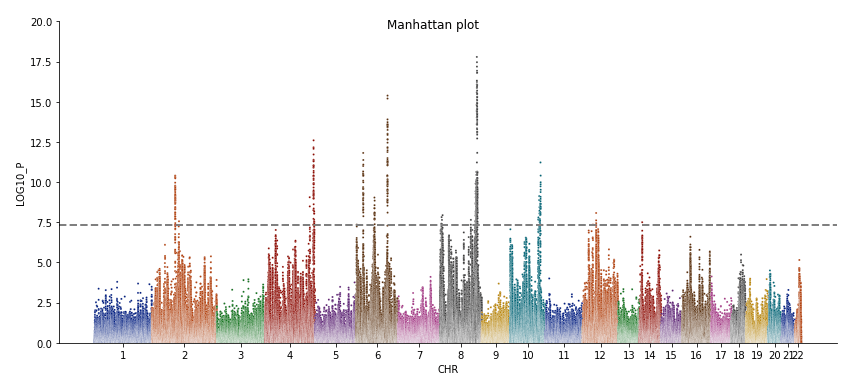
下面演示用PYTHON进行绘图:
import pandas as pd
import numpy as np
import matplotlib.pyplot as plt
import seaborn as sns
Marees, A.T., de Kluiver, H., Stringer, S., Vorspan, F., Curis, E., Marie-Claire, C., and Derks, E.M. (2018). A tutorial on conducting genome-wide association studies: Quality control and statistical analysis. International Journal of Methods in Psychiatric Research 27.
FID1	Family ID for first sample
IID1	Individual ID for first sample
FID2	Family ID for second sample
IID2	Individual ID for second sample
RT	Relationship type inferred from .fam/.ped file
EZ	IBD sharing expected value, based on just .fam/.ped relationship
Z0	P(IBD=0)
Z1	P(IBD=1)
Z2	P(IBD=2)
PI_HAT	Proportion IBD, i.e. P(IBD=2) + 0.5*P(IBD=1)
PHE	Pairwise phenotypic code (1, 0, -1 = AA, AU, and UU pairs, respectively)
DST	IBS distance, i.e. (IBS2 + 0.5*IBS1) / (IBS0 + IBS1 + IBS2)
PPC	IBS binomial test
RATIO	HETHET : IBS0 SNP ratio (expected value 2)

![E[\chi^2|l_j] = {{Nh^2l_j}\over{M}} + Na + 1](https://s0.wp.com/latex.php?latex=E%5B%5Cchi%5E2%7Cl_j%5D+%3D+%7B%7BNh%5E2l_j%7D%5Cover%7BM%7D%7D+%2B+Na+%2B+1&bg=ffffff&fg=333333&s=3&c=20201002)