GWAS中的有效样本容量对于后续分析十分重要,错误或不准确的估计会影响对GWAS结果的进一步解读。这里简单介绍病例对照GWAS中有效样本容量的定义,以及与一些容易混淆的概念的区分。
病例对照GWAS中有效样本容量
病例对照GWAS中有效样本容量(Effective sample size, ESS)通常定义为在病例与对照比例平衡 (Case: Control = 1:1; 也就是病例,对照各占比50%) 的研究里,得到等效检验效能的样本量。这样定义使得不同研究间的样本量可以进行比较。
注意: 有效样本容在不同的前后文背景下有更一般化的定义,也就是在简单随机样本的情况下,能够达到与目标样本某项数值同等化精度的样本量大小,例如在问卷调查中,Markov chain Monte Carlo中,时间序列分析中等。本文只针对病例对照GWAS中的Effective sample size进行介绍。
假设v为病例所占总体的比例,N为总样本量,即病例加对照,Neff为有效样本量,对于某个SNP其效应量beta的se可以写为

则有效样本容量可以通过下式计算

在其他文献中也时常看到其等价的表示方式
N_eff = 4 * Ncase * Ncontrol / (Ncase + Ncontrol)
或者
N_eff = 4/(1/ncase + 1/ncontrol)
同时还有其他的计算方法(假设的case, control比例不同)
https://www.nature.com/articles/nprot.2014.071
N_eff = 2/(1/ncase + 1/ncontrol)
荟萃分析时有效样本量的计算
需要注意的问题 : 单个研究的有效样本量的加和不等于整体prevalence计算得到的有效样本量
两种推荐的计算方法:
- 简单方法 :单独的研究有效样本量的简单加和
- 没有单独的研究有效样本量数据时可基于荟萃后的sumstats近似估计: 4/(2pq x SE^2). 其中pq为 MAF*(1-MAF)
详细推导和分析可以参考
Grotzinger, A. D., de la Fuente, J., Privé, F., Nivard, M. G., & Tucker-Drob, E. M. (2023). Pervasive downward bias in estimates of liability-scale heritability in genome-wide association study meta-analysis: a simple solution. Biological psychiatry, 93(1), 29-36.
与有效群体大小区别
有效群体大小 (Effective population size, Ne) 群体遗传学中一个重要的概念,其描述的是等效的理想化Wright–Fisher population群体的大小,决定了由genetic drift导致的群体构成发生的变化。其定义中的等效是对于某种遗传数值而言,可以指 allele variance (variance effective population size) 或 inbreeding coefficient (inbreeding effective population size)。概念上与有效样本量有类似之处,但具体所指对象不同,注意不要混淆。
估计数量性状的线性混合模型GWAS中的有效样本量
目前大多GWAS都采用了线性混合模型,其优点是允许纳入存在亲缘关系的个体,但会影响有效样本量的大小,对于这部分的讨论可以参考
Ziyatdinov, A., Kim, J., Prokopenko, D., Privé, F., Laporte, F., Loh, P. R., … & Aschard, H. (2021). Estimating the effective sample size in association studies of quantitative traits. G3, 11(6), jkab057.
参考
Grotzinger, A. D., de la Fuente, J., Privé, F., Nivard, M. G., & Tucker-Drob, E. M. (2023). Pervasive downward bias in estimates of liability-scale heritability in genome-wide association study meta-analysis: a simple solution. Biological psychiatry, 93(1), 29-36.
https://sphweb.bumc.bu.edu/otlt/mph-modules/bs/bs704_power/bs704_power_print.html

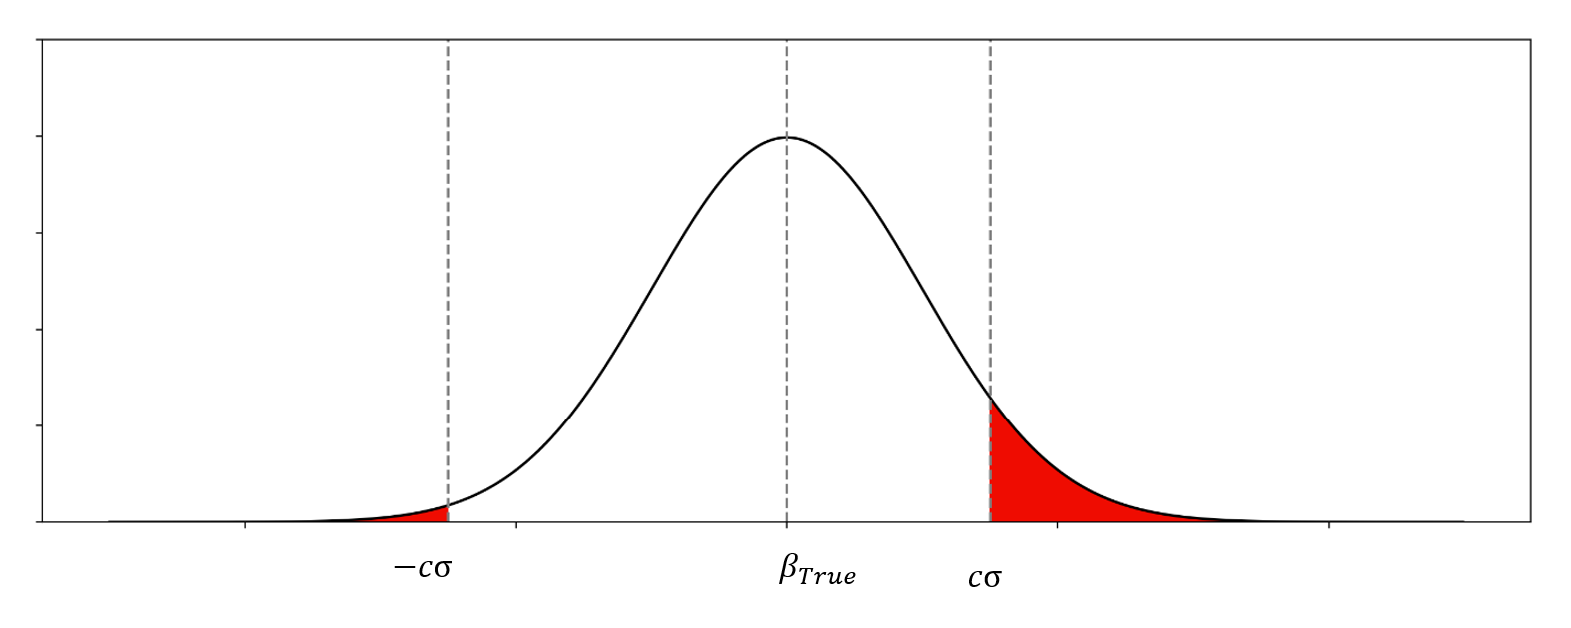
 的近似分布为:
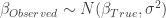

 的一个例子
的一个例子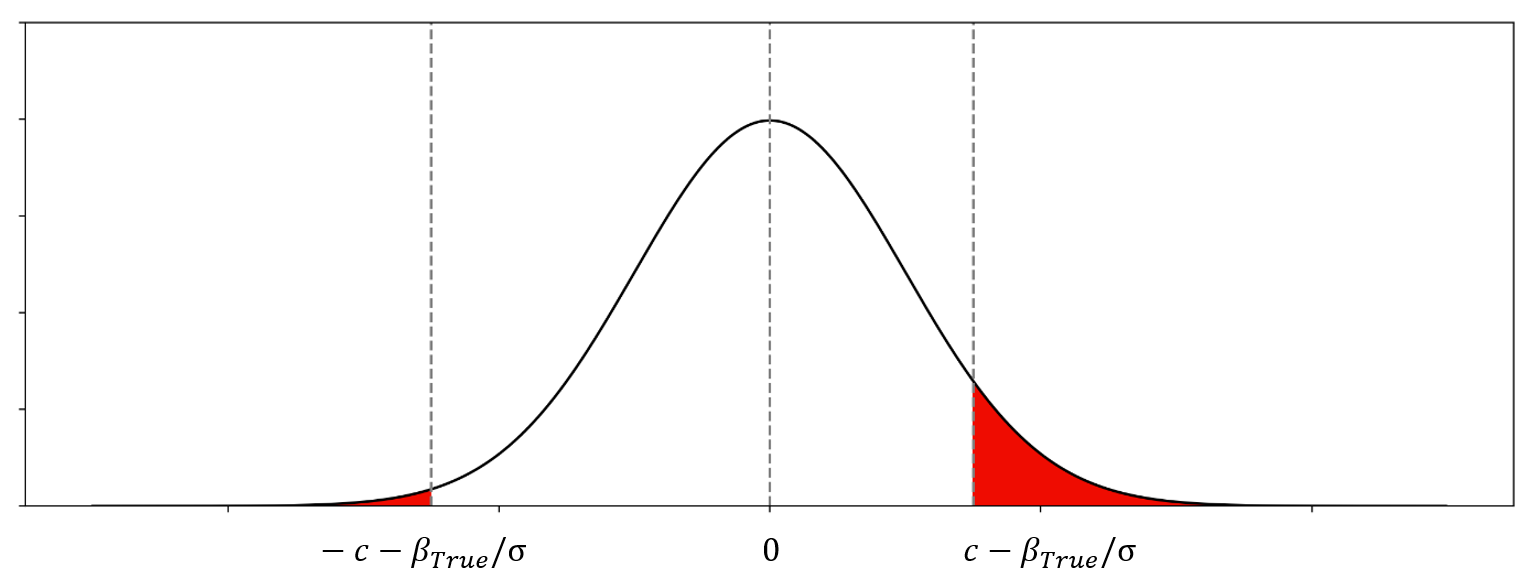


 : 标准正态分布的概率密度函数
 : 标准正态分布的累积分布函数
 , SE
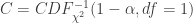
, SE  , 以及用于筛选的显著性阈值决定.
 个样本为AB基因型的精确概率为:

![\geqq P(N_{AB} = n^{*}_{AB} | N, n_A)] \times P(N_{AB} = n^{*}_{AB} | N, n_A)](https://s0.wp.com/latex.php?latex=%5Cgeqq+P%28N_%7BAB%7D+%3D+n%5E%7B%2A%7D_%7BAB%7D+%7C+N%2C+n_A%29%5D+%5Ctimes+P%28N_%7BAB%7D+%3D+n%5E%7B%2A%7D_%7BAB%7D+%7C+N%2C+n_A%29+&bg=ffffff&fg=333333&s=2&c=20201002)
 为一个指示函数. 如果x为真,
  ; 否则,
; 否则,  .
. 与统计学检验结果(是否拒绝原假设


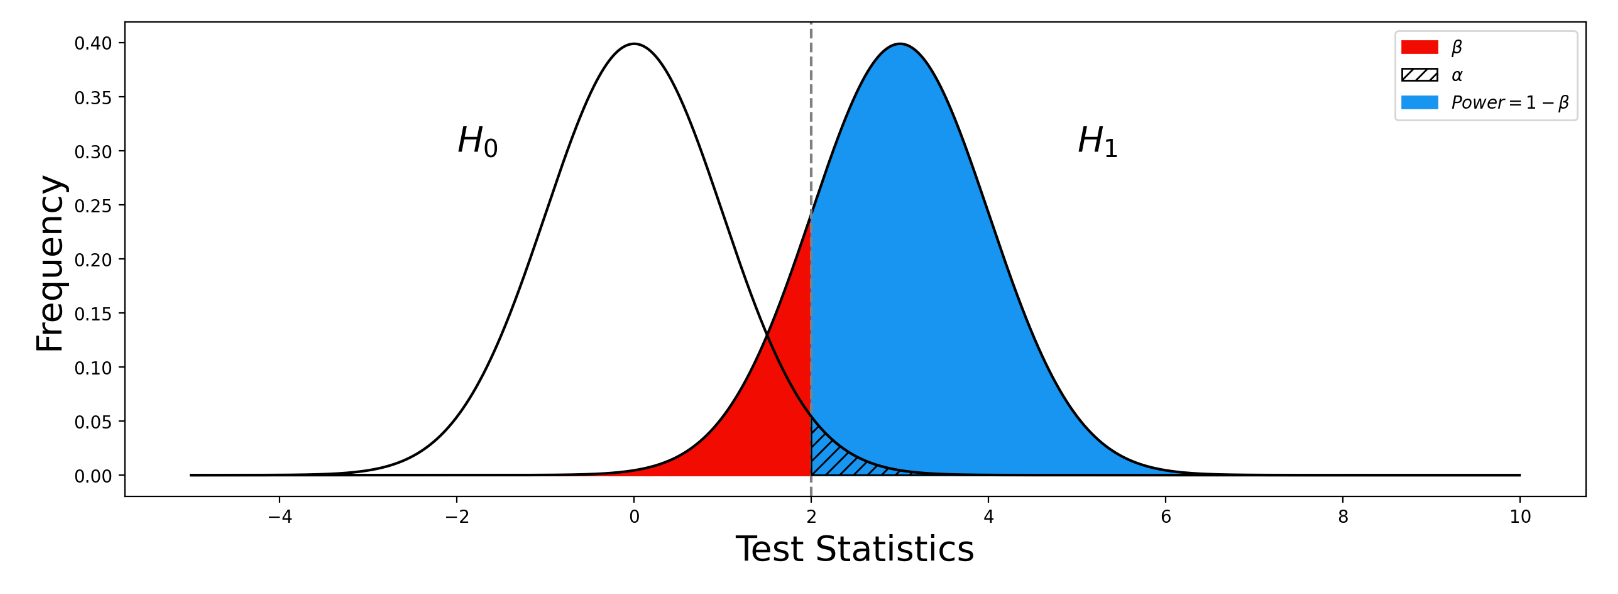
 之间差异的程度。
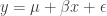


 : 该变异的等位频率(allele frequency)
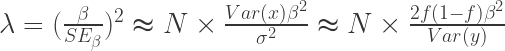
 分布的非中心参数NCP则为
 :
: 
 : 非中心参数NCP为
 的
的 : 在病例中风险等位的频率 Risk allele frequency in cases
 : 病例的样本量 Number of cases. The total allele count for cases is then
  .
. : 在对照中风险等位的频率 Risk allele frequency in controls
 : 对照的样本量 Number of control. The total allele count for control is then
  .
. , 即风险等位的频率在病例中与对照中是一样的。